+_+%5ETick+(5+Min)++10_8_2013.jpg)
Tuesday, October 08, 2013
Oct 8, 2013 Market Action
Attached is a chart with some comments and the s/r lines for today. Lots of lessons in the chart today. Have a look, it was a great day for trading with some nice moves.
+_+%5ETick+(5+Min)++10_8_2013.jpg)
Tuesday, September 24, 2013
Sept 24, 2013 Marke Action
If you saw or had access to last nights update you will see that I called a reversal right at the low today. Check out chart below and see where the support was. These numbers and the trading plan was sent to all our active subscribers last night before the open. You to can benefit from this information.


Tuesday, September 10, 2013
September 10, 2013 Market Action
The ES gapped up 10+ points and quickly sold off from the 1680.75 Fixed resistance area and pulled back 3.75 points to 1677.00 just above fixed support before turning back up again. I outlined some potential trade able spots on the chart which were the best opportunities today.
+_+%5ETICK+(5+Min)++9_10_2013.jpg)
+_+%5ETICK+(5+Min)++9_10_2013.jpg)
Monday, September 09, 2013
September 9, 2013 Market Activity
Today's theme: Resistance Once Broken Becomes Support. This is a very basic concept that works time and time again. Check out the chart with the arrows. Those lines represent the Fixed s/r numbers given to members the night before and the arrows show where the resistance broken turned to support for some real nice entries on the ES today.


Monday, August 19, 2013
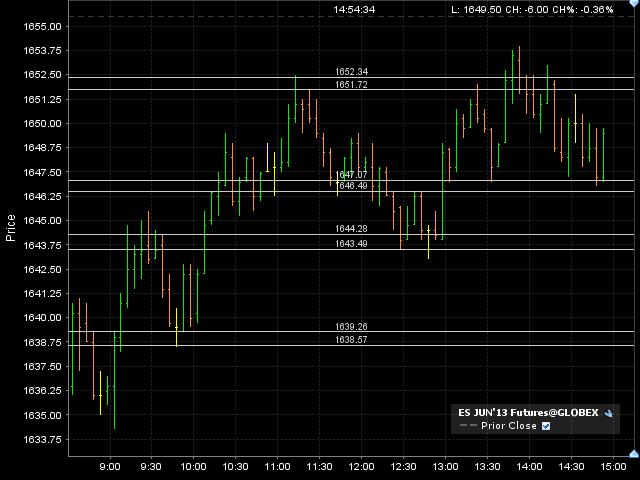
August 19, 2013 Market Action
The market opened up just under 1654 resistance
and dropped down just above the 1648 support level
where is found some buyers and attempted a move
to the 1657 level. A 123 top setup after that and
the market came down giving us a nice opportunity
to short after the 1654 level was broken and held.
That trade was good for about 6 points down to
the 1648 level where the market found support as
anticipated by the nightly update and once again
after that level broke and held we got another
opportunity to short for another great trade down to
1643 for about five points.
Learn how to spot these levels and trade around them
with my setups and the techniques I teach in the ebook
and the DVD set. There are multiple opportunities everyday
for you to make a profit in this market.
+_+%5ETick+(5+Min)++8_19_2013.jpg)
Tuesday, July 16, 2013
July 16, 2013 Market Action
Today the market opened up and tagged the 1679.50
resistance area and quickly sold off. A break of the
1676.50 support area had us on alert for a move
down and a retest of the dynamic support at the moving
averages gave us the short entry we needed to ride
a nice move down to the 1672.50 area and then down to
the 1670 support. A bounce back up to the dynamic
resistance area at the moving average gave us another
opportunity for a short position down to the 1666.50
support area which turned out to be the low of the
day. The market double bottomed there ant ran up to the 1672.00 res
area where it sold off again to test near the 1666.50
area where is got some footing and moved back up
to the 1672.50 area.
Today the market gave us some nice moves to profit
from all from within the s/r areas and zones. These
are the days that make our month , if you are able
to trade around these levels and identify them
before the market opens and throughout the day.

Monday, July 15, 2013
July 15, 2013 Market Action
Today the market opened up at the 1675 resistance
area nad quickly ran up. That was rejected and the
market came down but did not stay under that level
for very long and on a retest was able to hold the
gains. The setup a decent long trade tot he 1678 area
resistance which held the market back for a while.
Then the market broke thru and it acted as support
for a small gain long trade. Eventually that
area broke down and acted as resistance again
at the end of the day.
The market was framed well with the s/r numbers from
last night, which is not surprising. The nightly
update can you give you a real edge but you need to
know how to trade around these levels. That is why
when you buy the ebook you get 2 free weeks of live
intraday updates and nightly updates with your purchase.
check out the book on the website.

Thursday, July 11, 2013
July 11, 2013 Market Action
Big gap up today in the markets and mostly sideways
trading for the day until the afternoon when
the market broke out to the upside. Still if you see
the chart below you can see that we gapped up
above the last resistance level, which of course
turned into support. You can see how the market bounced
several times from there and was not able to stay
below it for very long. That is sign of strenght and
would have you looking to the long side. Later in
the day after the break out you can see the dynamic resistance
at 1667.00 was brokine with conviction and a retest
proved successfull for a bounce and a good place
to get long.
With my market timing techniques I can show you how
to get an edge in this market so that when you get in
you can expect the market to move in your direction
almost immedieately, and if it doesn't you cut your
losses to a minimum. I teach this and many other day
trading techniques in the courses. Check out he website
for more information.

Tuesday, July 09, 2013
July 9, 2013 Market Action
Today the market opened up near the 1644 resistance
area and immediately shot up to just under the 1647 res
area. A pullback to the 1642 res now support held
the market up for a few minutes before a dropp down
to the 1638 level. The market found its footing there
and took out the 1642 leve and then came back to
test it for a run up to the 1648 area of resistance.
The market then went sideways between the 1644 now
support and the 1648 area for the rest of the day.
The hold of the 1642 and then the 1644 areas provided
us with some good opportunities to get long and take
advantage of this move up into the 1648 area.
If you had the levels on your chart you can see
how the market breaks the resistance area and then will
test it as support. These key levels are where we
find the best opportunity to profit. You need the proper
entry and exit techniques to benefit and that is exactly
what I teach in my ebook and courses. Don't dely get
your copy and start understanding what trading is really
about.

Friday, June 28, 2013
June 28, 2013 Market Action
Today the market opened up at the 1601 support level
but could not keep above for very long. A Run down
to the 1595.00 support turned the market back up
and through the 1601 support which was now resistance.
since that level broke it acted like support which
setup a nice long trade to the 1606 resistance area
where the market hesitated a bit. The was broken and
the market ran up to 1610.00 . That acted like a lid
on the market all day. The market really stayed between
the 1602 area and 1610 area pretty much the rest of
the day until the last half hour when the 1610 zone
was rejected for the last time and the market came
down reall fast to the 1595.00 zone again.
As you can see from the chart below , the support and
resistance zones really framed the market well today
and by having these lines on your chart you would
be able to take advantage of the opportunities available, but
you need to know the setups and the how to trade them.
+_+%5ETick+(5+Min)++6_28_2013.jpg)
Wednesday, June 26, 2013
June 26, 2013 Market Action
Today the market gapped up into the third resistance
level published in last nights update. That was in line with
one of my setups to get short and the market came
down to the 1593.50 are where it stalled a bit
but continued to go down to the 1587.75 support area. That
turned out to be the low of the day and the market
started its run from there. Resistance than was broken
and turned into support which gave some very nice
buying opportunities as the market rallied up to the 1601.00 area.
Sellers came in near the close to bring the market back down the
the intraday level give at 1595.00.
Having a game plan for the trading day is an important
part of my routine. It increases your odds for success
and I encourage all of you to at the very least have a plan
for your trading. Understand how you will react and
plan our your trades in advance, because in the heat of the
moment emotions can take hold and it will be detrimental to
your success. Good Trading.

Monday, June 24, 2013
June 24, 2013 Market Action
Today we gapped down and after bottoming out near the
1553.00level the market started a slow and steady
grinding higher taking out two of the previous support
turned resistance. Aft reaching the 1578 area the
market could not keep above that area and a retest
failed for a reversal of the uptrend that started mid day.
There were many opportunities today in this two sided
market. You just need to know where the support and
resistance levels are and how to trade around them.
Certainly a major part of my strategy revolves around
the fixed support and resitance levels. But I do want
to point out that finding the dynamic areas on the chart
is equally important and only serves to at least double
the number of opportunities there on any given day.
In trading when you know that you have many opportunities
to make a trade you suddenlty realize that you don't need
to chase the market and when you miss a move it really is
no big deal. That change in psychology goes a long a way.
If you are interested in trading, what better principles can you
learn then those taught by a 30 year day trading veteran
that puts it on the line everyday. Check out the website and the course
available today.

Wednesday, June 19, 2013
June 19, 2013 Market Action
Today we had mostly sideways action pre fed announcement.
But for those who were patient a classic setup that
I teach in the course occurred post fed announcement for
a profit potential of 10 plus points. Check out the
chart and see how the support and resistance levels
frame the market and can give you opportunities to
profit.
I marked the chart with an arrow showing the location
of the trade. I even alerted the subscribers that
the 1635 level was a dynamic resistance level and
to look for a reaction there. The dynamic resistance
level are formed through out the day and I teach
students how to find these zones in the trading camp
that I hold once or twice year.
Check out the website to get more information or contact
me via email.

Monday, June 17, 2013
June 17, 2013 Market Action
The market gapped up higher today above three resistance
levels and then ran up to exceed the the fourth level
at 1369.50. The push thru was brief and after chopping
sideway another attempt to push through failed the
selling started. That set up for great shorting opportunity
which had a potential profit of about 15 es points.
The key in a market like that was to be patient and
wait for the right setup.
If you missed that one there were some other bounces that
were very shortable if you had the right method and
techniques to enter. Later a 123 bottom formed giving
us another opportunity to get long and with a profit
potential of about 10 es points.
If you would like to know more about my setups and
the techniques I have used for over thirty years check
out the Ebook and some of the other trading courses on
the website.

Monday, June 10, 2013
June 10, 2013 Market Action
Today the market opened up just above the first
resistance level at 1647.00 and ran up to tag
the 1648.00 Second resistance level. That was
rejected and a deep pullback to just above initial
support brought in some buyers. Some Sideways action
at the 1647.00 resistance level and the market came
back down to test the low of the day and continued
to trade sideways for the rest of the day.
There were some decent opportunities for trading
today although not many. However with my style of
trading you will at least find 2-3 trades a day
on most days.
++6_10_2013.jpg) PS. I used Ninja Trader Charts today.
PS. I used Ninja Trader Charts today.
resistance level at 1647.00 and ran up to tag
the 1648.00 Second resistance level. That was
rejected and a deep pullback to just above initial
support brought in some buyers. Some Sideways action
at the 1647.00 resistance level and the market came
back down to test the low of the day and continued
to trade sideways for the rest of the day.
There were some decent opportunities for trading
today although not many. However with my style of
trading you will at least find 2-3 trades a day
on most days.
++6_10_2013.jpg)
Wednesday, June 05, 2013
June 5, 2013 Market Action
Today the market opened just under initial support
and gave us a great shorting opportunity right from
the get go. That rejection there at the 1628.75
was the clue that we would possibly be heading lower
Then we had a great last trapped trade setup around 930 CST
for a good profit of the down side. We then had a support
turn resistance trade for another nice short today.
These are the days that we strive for in the markets.
It's all about making your losers small and taking advantage
of the opportunity when the market gives them to us
to make our winners big.
Get on board and pick up a copy of the ebook and DVD course
to start to learn how to trade these markets. With me you get
full support and answers to any questions. Contact me
for more details or with any questions you may have.

Tuesday, June 04, 2013
June 4, 2013 Market Action
Nice Range today and some really good opportunities
to make some decent gains. I have outlined on the
chart below 5 very basic trades that I can teach
you how to take based on my trading techniques that
I have been using for over 30 years.
You can see by the arrows and there was no shortage of
opportunity today. As a matter of fact the markets
are full of opportunity every week to make a decent
return.

Monday, June 03, 2013
June 3, 2013 Market Action
The market bounced early from initial resistance
on Monday but was not able to clear initial resistance. A
rejection brought the market down to test the bottom
support level and after a small bounce from there
the market went sideways for a while before staging
a run up to the initial resistance area.
Once the market got going and held the 1626.50 area there
were some great opportunities to make some decent
points today. I highlighted two of the many
chances available today to make some nice trades.
Daily there are ways to trade this
market safely and profitably. Get on board and
pick up a copy of the ebook.

Friday, May 31, 2013
May 31, 2013 Market Action
Very good range today and lots of opportunity to make
some great trades. See the chart and observe how price
moves between the support and resistance lines I had
drawn before the market opened up today. You can see
when support holds and resistance breaks where
the long opprotunities are. Then as support breaks
and is held as resistance you can see how the market
gives us shorting opportunities.
Today was a great trading day and if you knew the setups
to look for at the support and resitance lines you would
have had a fantastic day. Don't delay get your copy of the
ebook and learn these setups ASAP.

Thursday, May 30, 2013
May 30, 2013 Market Action
Today the market made a straight run in the early
going past through the initial resistance.
An overshoot of the the 1656 area brought the market
back down to the 1652 old resistance now turned support
for a move back up to test the 1656 area. The market
rejected that area and again bounced off of the 1652 support
area and continued to move up to just under the 1661 res
area before coming back down to the 1655 zone.
There were many good setups today and some real
nice trades off of what I call dynamic resistance
and support levels. I show you how to find these
dynamic levels in my ebook and DVD series. With fixed
areas and dynamic areas to trade off of, there is
no shortage of opportunity for you in this market.

Tuesday, May 28, 2013
May 28, 2013 Market Action
After a gap up open and run up to 1673.00 the market
came down and was pretty much in a down trend all day
until reaching the 164.00 area labeles as resistance
turned support on the gap up open.
Severl very good setups to trade today based on
my ebook setups. We had 123 top a couple of slinky
patters and some other setups which would have allowed
you to catch to catch some of the nice moves today
Don't delay get your copy of the ebook now.

Friday, May 24, 2013
May 24, 2013 Market Action
 Today the market opened up near the the 1638 support
area and made a small run to the 1642 support now resistance.
A failure there brought the market back down to break the
1638 area and it pushed down to the 1634.50 zone.
After moving sideways and holding that support zone
the market moved up to test the 1642.50 zone and
was able to break through making a run up to the 1646.25 area.
A pullback held the 1642.50 zone and the market made another run
at the highs and ending the day near the highs.
Nice trade opportunities today in trading with the
support and resistance zones. I can show you the setups and
how to find these zones and will find them for you until you
feel confident to come up with them on you own. Check out
the ebook and trading camp coming up.
Thursday, May 23, 2013
May 23, 2013 Market Action
Today the market opened up at the bottom suupport
zone and after just poking underneath a run up to
support zone number 2 which was now resistance held
the market back and a hold above the 1638.50 provided
a nice long opportunity for a break out to the 1652.00
area. The market found some footing near the 1644 area
and bounced back up to test the high of the day but
was rejected and we headed slightly off the high
for the remainder of the session.
Many Support and Resistance levels in paly today.
Learn how to trade around these areas and profit
in this great volatility we have been seeing these
past few days. Check out the ebook and DVD courses
for some great training on trading this market.
Wednesday, May 22, 2013
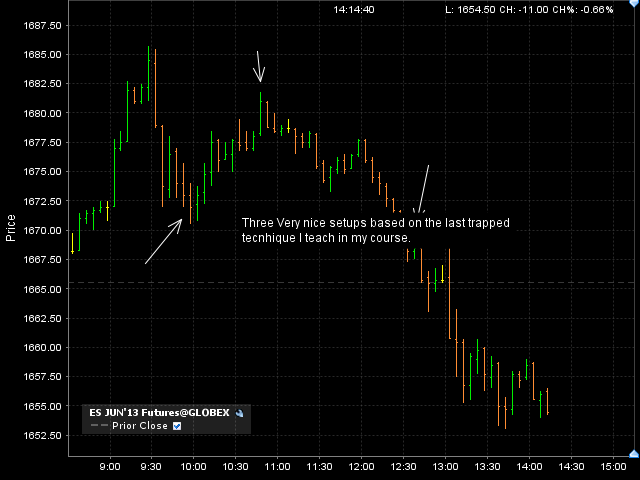
May 22, 2013 Market Action
Good action today from the news and we had a good range. There were some real nice last trapped setups today. I teach the setup in my ebook and walk you through it in the DVD course. I have attached a chart with some arrows pointing towards the areas where the opportunities occurred. Trading camp is coming up and if you have not signed up there are still a few spots open so take advantage of the opportunity to learn from a professional trader. I only do these once or twice a year.

Tuesday, May 21, 2013
May 21, 2013 Market Actions
Today the market opened up just at support and
after a small attempt to go up the market came
down and pierced through the support area. The market
moved pretty much sidways under the support area
before breaking it to the upside. With the hold
over the support area the market mades its way up to
to the resistance area 1673.00. A slight pullback and
a test of that area failed and the market pulled back
into the close.
Againt the market is respecting the s/r lines fairly
well and with the right knowledge and setups you
can take advantage of the opportunity the exists to make
profits.

Subscribe to:
Posts (Atom)

